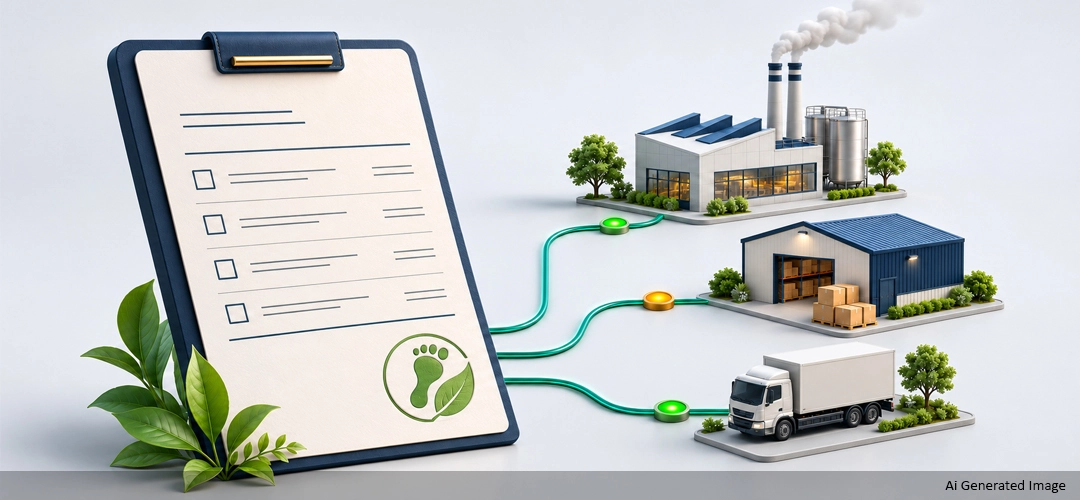
Whenever you ask companies where their carbon emissions start, their honest answer is “Our Suppliers”. Scope 3 covers everything in supply chain management from upstream to downstream. The raw materials you buy, the goods you ship, the services you outsource. They are the hardest to measure and they make up the largest share of the total carbon footprint of supply chain management.
Sustainability reporting used to be voluntary until a few years ago, but that has changed now. US and EU regions are paying close attention to greenhouse gas emissions across the whole supply chain. Investors, customers and partners are now asking for proof, not promises. But it has not been a smooth road. There were times when corporate lobbies started pushing back against these requirements but things started changing once they started receiving harder pushback from environmental lobbies. Due to this, regulations were introduced at a stricter level in the US and EU region.
A lot of companies these days prefer suppliers who keep transparency in this area. Suppliers with recorded and documented carbon emissions records have started receiving more business. The companies don’t mind paying higher prices to these suppliers as they trust those who have recorded and documented their sustainability reports. This is proving beneficial for these suppliers in the long term.
Carbon emissions are divided into three scopes.
Scope 1: Covers direct emissions from sources you own or control, such as company vehicles, boilers, and on-site processes.
Scope 2: Covers indirect emissions from the electricity, steam, heating and cooling you buy.
Scope 3: covers everything else in your value chain, including purchased goods and services, capital goods, transport and distribution, waste, business travel and employee commuting.
Scope 3 is the largest part of an organisation's footprint, also the hardest to measure. It can't be managed alone. You need information from your suppliers.
A few years ago, sustainability reporting sat mostly with the sustainability or finance team which is changing now as regulators, investors, customers and tender panels increasingly ask businesses to show the impact of their supply chain, not just their own sites.
Procurement is the function that decides who you buy from, what you buy and how much you buy. If carbon data isn't part of that decision, it can only be reported after the full transaction which makes it untraceable. Procurement teams now need to know emissions before an order goes out, not months later in a report.
Most companies don’t lack good intentions, but they lack documentation. Supplier data gets jumbled up in emails, spreadsheets and PDFs. When auditors and regulators ask for the records, nobody is able to answer. Their purchase orders and sustainability reports are in different systems.
If you want credible Scope 3 reporting, the best place to begin is where the purchase begins: The Purchase order. Let’s look at a real-time example of a client’s purchase order.
The first question is simple: where are our emissions coming from? The category report answers it.
Categories with High Carbon Emissions (4 records)
| Category | Category No. of POs | Total Spend (USD) | Total Spend (USD) Item-Level Emissions (kgCO₂e) | Supplier-Level Emissions (kgCO₂e) | Total Emissions (kgCO₂e) | Intensity (kg per USD) |
|---|---|---|---|---|---|---|
| Development | 24 | 11,247,945.68 | 0.00 | 2,064,900.80 | 2,064,900.80 | 0.18 |
| Food | 3 | 701.94 | 0.00 | 218,176.00 | 218,176.00 | 310.82 |
| Chemical | 8 | 821.92 | 0.00 | 90,653.27 | 90,653.27 | 110.29 |
| IT Hardware | 1 | 0.00 | 0.00 | 10,230.00 | 10,230.00 | 0.00 |
Spend and emissions tell different stories: Development makes up almost all of the spend (over 99.9%) and about 87% of the emissions. Food and Chemical together are about 0.01% of spend, yet they produce roughly 13% of total emissions.
Intensity is where the surprise is. Food comes in at 310.82 kg per USD, against 0.18 for Development. That is more than 1,700 times higher. A report sorted by spend alone would never have flagged it.
Low spend does not mean low impact. The single IT Hardware PO has zero recorded spend but still carries 10,230 kgCO₂e, so it only shows up because emissions are tracked separately from cost.
The source of the data matters. Item-level emissions are 0.00 across the board, so every kilogram here comes from supplier-level data. That is an honest starting point, and it shows where to improve next: asking suppliers for product-level figures.
Once you know which categories matter, the next question is which orders and which suppliers are driving them.
POs with High Carbon Emissions (Top 10 shown)
| Order No. | Order Date | Status | Supplier | Category | Total Spend (USD) | Emissions (kgCO₂e) | Intensity (kg per USD) |
|---|---|---|---|---|---|---|---|
| 800513 | 11-Aug-2025 | Received | Acme Supplies Inc | Development | 5,902.60 | 30,001.84 | 5.08 |
| 800519 | 14-Aug-2025 | Closed | Acme Supplies Inc | Development | 5,902.60 | 30,001.84 | 5.08 |
| 800520 | 14-Aug-2025 | Approved | Acme Supplies Inc | Food | 450.40 | 8,965.84 | 19.91 |
| 800544 | 30-Oct-2025 | Partial | Acme Supplies Inc | Development | 3,800.00 | 4,360.00 | 1.15 |
| 800566 | 26-May-2026 | Partial | Acme Supplies Inc | Development | 200.00 | 4,360.00 | 21.80 |
| 800507 | 03-Jul-2025 | Closed | Flo-Tech | Development | 100,000.00 | 3,877.70 | 0.04 |
| 800510 | 11-Aug-2025 | Unissued | Acme Supplies Inc | Development | 300.00 | 1,234.40 | 4.11 |
| 800517 | 13-Aug-2025 | Unissued | Acme Supplies Inc | Development | 240.00 | 987.52 | 4.11 |
| 800499 | 23-Jun-2025 | Unissued | BlueSky Innovations | IT Hardware | 0.00 | 750.00 | 0.00 |
| 800543 | 30-Oct-2025 | Unissued | Flo-Tech | Development | 500.00 | 270.00 | 0.54 |
Order size is a poor guide to impact. PO 800507 with Flo-Tech is the biggest order on the list at USD 100,000, yet it emits just 3,877.70 kgCO₂e (0.04 kg per USD). PO 800566 with Acme is only USD 200 and emits 4,360 kgCO₂e, an intensity of 21.80. That is more than 500 times higher.
The same supplier can look very different across orders. Acme’s intensity runs from 1.15 to 21.80 depending on the category and the order.
Food is a clear outlier. PO 800520 is only USD 450.40 but carries 8,965.84 kgCO₂e.
Unissued orders are visible too. Several of the rows are still unissued POs. Because the emissions show up before the order goes out, a buyer can ask for a lower-carbon option or a different supplier while it still counts.
Prioritise by intensity as well as spend. Food and Chemical look tiny on a spend report and are not tiny on emissions.
Open a conversation with high-intensity suppliers. The PO view shows exactly which orders and suppliers to raise.
Move from supplier-level to item-level data over time. That makes the numbers more precise and more defensible in reporting.
Act before the order is issued. Unissued POs are the cheapest place to change an outcome.
This is the idea behind Scope 3 starting at the purchase order. The data is already created when you buy. The only question is whether you capture it there or reconstruct it later in a spreadsheet. Because every business buys differently, ebuyerassist can be set up around the categories, thresholds, and reports each client actually needs.
Every purchase will tell a story. What you bought, from whom, what quantity and where it came from. When you start recording and tracking that information from the moment of purchase, you start building a carbon trail as a natural part of the buying process, rather than chasing the suppliers for data at the year end.
Our Eyvo cloud procurement platform lets you keep a record of every transaction, from purchase, request, order to the final delivery. This gives you:
An end to end audit trail for every purchase order, whenever regulators or auditors ask for it.
Real time tracking of your carbon footprint which is connected to your real spend, so your CO2e figures rest on actual transactions.
Suppliers insight, it helps you track which vendors produce more emissions and which are more sustainable and environmentally friendly.
Real time visibility of scope 3 at one place instead of different files.
Eyvo is highly customizable, and is build around your business because every business is different.
Keeping emissions tracking documented is a missed opportunity. Companies with clean and verifiable data can set realistic reduction targets, choose lower carbon suppliers and answer questionnaires without hesitation are able to get more tenders because buyers are asking for sustainability now. If you document your claims, you are less exposed to legal and reputational risk.
You don’t need to fix everything at once. Start with your highest-spend categories, bring your purchase orders into one system, and build from there. Each transaction you record makes your next report more accurate and your next audit easier.
Scope 3 (CO2e) reporting is not going away. Companies that handle it well will be the ones that treat procurement as the starting point.
Ready to build your carbon trail from the first purchase order? Talk to the Eyvo team about a setup tailored to your business.